Bilateral Graph
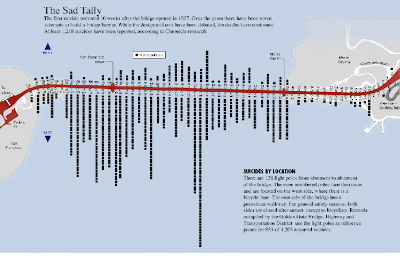
 A bilateral graph is effective in displaying two related variables and how they differ in function. Bilateral graphs are visualization maps that show both increase and decrease on either side of the same map. The map below shows the statistics and results of Golden Gate Bridge jumpers. this graph shows the number of people that committed suicide by their location on the bridge, the east and west sides of the bridge coordinate to positive and negative sides of the graph. By viewing the graph, it can be observed that more jumps occur on the east side of the bridge
No comments:
Post a Comment