Monday, April 25, 2011

Correlation Matrix
A correlation map shows a symmetrical, semi-definite correlation matrix. Mostly, correlation matrices represent the correlation of change and time and are positive trending. In the example below, there is a symmetrical correlation matrix on analyzed enzymes and metabolites. The variations in shading accompanied by the given values, provide a clear visualization of the coefficients between the two traits.


Star Plot Map

Star Plot Map


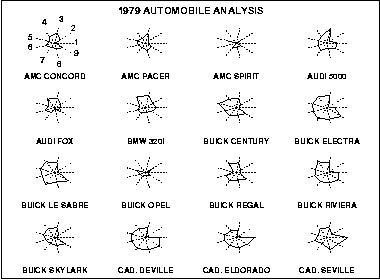
Star Plot maps are valuable tools that help to visualize comparisons of multiple variables for each observation. In the star plot example below of 1979 automobiles, the data of 16 cars is plotted. Each line plotted represents a different feature found in every car and the length of the line represents the quality of that particular set of data. These features are aspects such as price, mileage, and weight to name a few. These star plots can be observed individually, or they may be observed as a group so that common characteristics can be compared. The separate spokes representing quantities are equal-angular and are called radii. The plot gets its star-like appearance when lines are drawn connecting values.


Wind Rose Map

Wind Rose Map


Wind Rose Maps, visually display the distribution of wind direction. In this particular example from the NOAA website, the direction was recorded at one site for 24 hours. The percentage of time which the wind comes from a certain direction by the rings and the color changing represents the percentage of time which the wind came from that particular direction.


Similarity Matrix Map

Similarity Matrix Maps such as the example below, are useful in providing quick visual assessments of how similar documents, terms, places, or data are. They are based on the level of similarity between results of data and use both numerical charts and the visual density of pixels in a chart form to characterize and display information.


Triangular Plot Map


Triangular Plot Map

Triangular Plot Mapping is useful in that it is able to display three dimensions or qualities of a given subject while also showing their relation to each other. In the example below, triangular mapping is used to show implications of correlations between skin color and genetic ancestry of West Africans, Europeans, and Indigenous people for biomedical research. From the triangle plot, it can be readily observed that the majority of humans come from some stem of West African descent. 


Stem and Leaf Plot Map

Stem and Leaf Plot Map

Stem and leaf plot maps are valuable in that they display numerical data in such a way that one can easily determine the mean, median, and mode in a set of data with just a glance. By organizing data by place value, one can easily determine the 'ones' values from the 'tens and more' values. The example plot below charts the number of students enrolled in a class over the course of years. The least number of students being 22, the median number being 57, and the most being 67.

Sunday, April 24, 2011

Histogram Map

Histogram Map


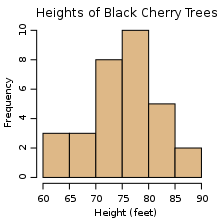
Histogram maps are useful in plotting the degree of density in a measurement of data over a given area. Histograms are unique in that they display tabulated frequencies, and in mapping, this makes the information easy to read  as far as the density of results is displayed. In the example below, not only are the various heights of black cherry trees displayed, but it is easy to see the average height of the trees.