Box Plot Map
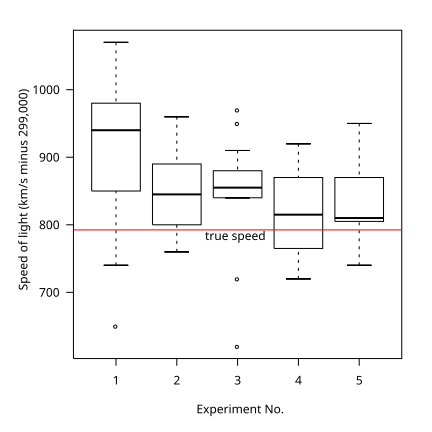
Box plots, also known as box and whisker diagrams, are a great way to simply display groups of numerical diagrams. They appear simpler than histograms or other charts displaying numerical information, but in their simplicity, they are preferred and useful because they make it very easy to determine outliers and differences in populations without making assumptions of the underlying statistical distribution. The example of a box plot below helps simplify and display the complicated results of an experiment in which the experimenter attempts to find a medium in which the true speed of light can be measured. The accuracy of the results over multiple attempts are displayed below along with their outliers.
No comments:
Post a Comment