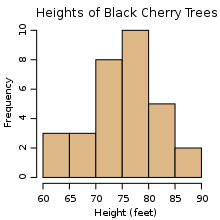
Histogram maps are useful in plotting the degree of density in a measurement of data over a given area. Histograms are unique in that they display tabulated frequencies, and in mapping, this makes the information easy to read as far as the density of results is displayed. In the example below, not only are the various heights of black cherry trees displayed, but it is easy to see the average height of the trees.
No comments:
Post a Comment