Statistical Map
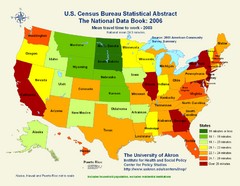 Statistical maps use dots, color variations, or a variety of other physical display techniques to represent the variations in quantities of a multitude of factors. Some examples of such factors include populations, rainfall or other weather patterns. In the example below, a statistical map created by the census bureau displays the amount of people that drive long distances to work in the U.S. Just by looking at the map below, one can easily see that the majority of Americans who commute a great distance to work each day live along the coastline.
No comments:
Post a Comment